Jump To: The Problem | How It Works | The Platform | What Districts Gain | Professional Services | FAQs
Most Districts Are Making Million-Dollar Decisions Without the Data to Back Them
Asset records are scattered
01
Equipment data lives across spreadsheets, paper binders, and individual staff members’ memories. There’s no single record of what’s installed, where it is, or what it’s cost to maintain.
Floor plans are static and hard to use
02
Plans sit in paper folders or static PDFs that can’t be updated in the field, don’t show asset locations, and have no connection to maintenance history or work orders.
Work orders aren't tied to real locations
03
Without location data, patterns are invisible. You can’t tell which wing, system, or building is driving most of your cost – until the emergencies start compounding.
Capital conversations start with "we think"
04
Without asset-level data, every board presentation, bond request, and insurance conversation relies on anecdotes. The ask is urgent – but not defensible. Boards can tell the difference.
Why Building Intelligence Is Urgent
12-18%
O&M Cost Savings
Preventive maintenance delivers 12–18% cost savings compared to reactive approaches — without significant capital investment.
Source: U.S. DOE Federal Energy Management Program (FEMP), O&M Best Practices Guide, Release 3.0
3x
Deferred Maintenance Cost
More is spent on reactive maintenance vs. reliability-centered approaches.
40–60% of maintenance activity is reactive. Best-in-class organizations keep reactive maintenance below 10% of program activity
Source: U.S. DOE FEMP O&M Best Practices Guide, Release 3.0; ASCE 2021 Report Card for America’s Infrastructure
One View of Every Building.
Work Orders and Facilities Drawings are the foundation of building intelligence. Together, they answer the three questions every facilities director needs answered: Where is it? What's its history? What should we do next?
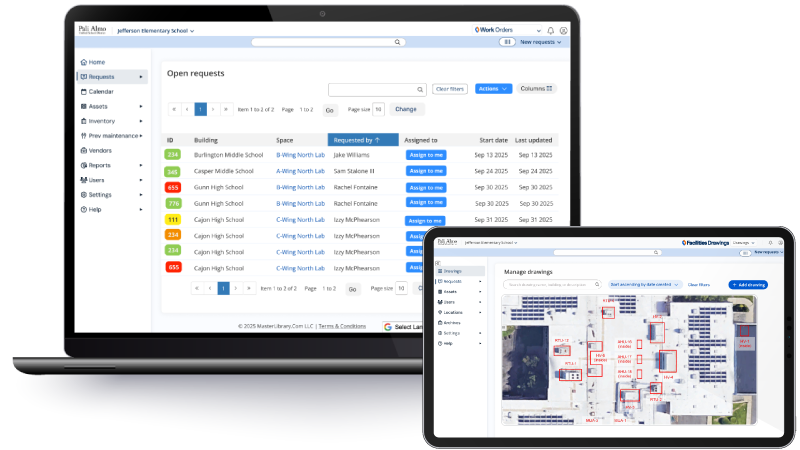
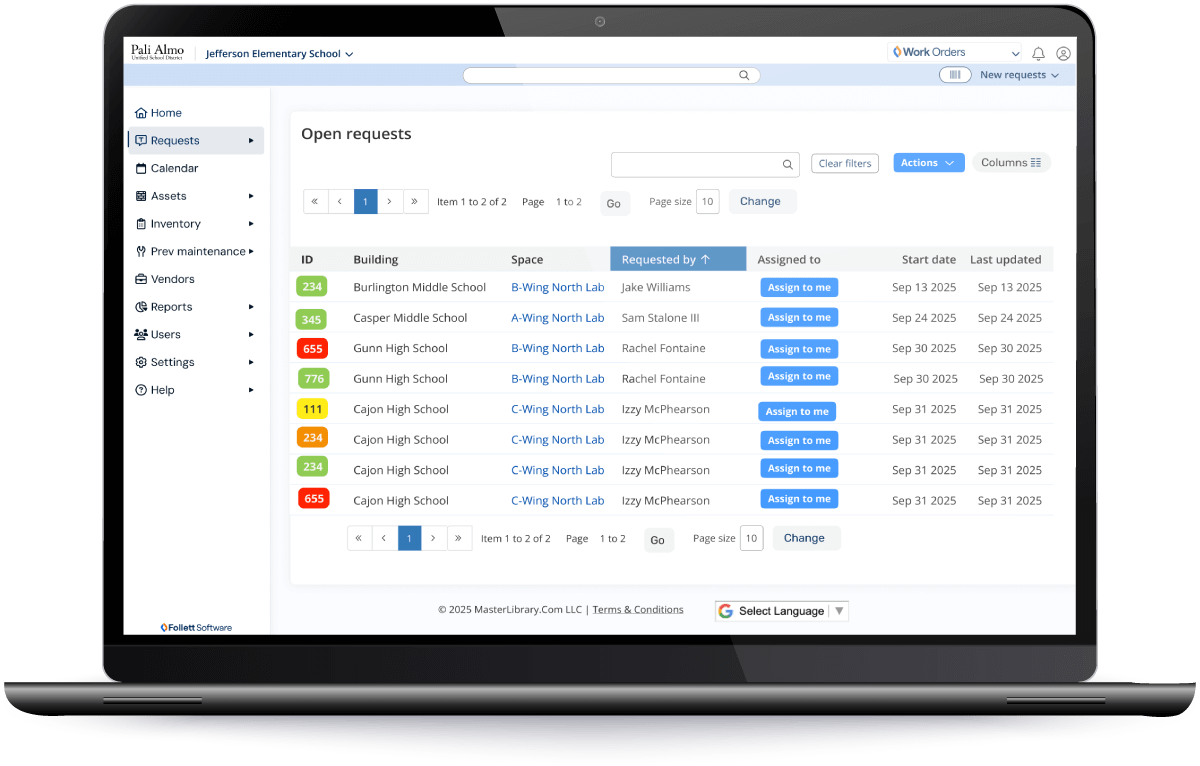
Work Orders
Every Request and Repair in One Place
Every maintenance request, PM task, and repair lives in one queue with full history - submitted, routed, tracked and closed without paper or phone calls.
How Work Orders Drives Building Intelligence:
- Single source of truth for every building
See all requests, preventive tasks, and repairs by building in one place—across schools, departments, and teams—so nothing gets missed or managed in side spreadsheets. - Context for every work order
Open any request and see the room, equipment, history, photos, and documents tied to that space so technicians know the full story before they roll a truck. - From reactive tickets to planned work
Heatmaps and trend reports surface buildings, systems, and assets that generate the most requests so you can shift from emergency fixes to planned projects. - Stronger decisions for leadership and the board
Leaders see backlog, response times, and spend by building to explain where dollars go and what it will take to catch up. - Connected to Facilities Drawings
Every ticket and asset lands on a floor plan so techs know exactly where to go, you can see where issues cluster, and deferred maintenance rises to the top of the list.
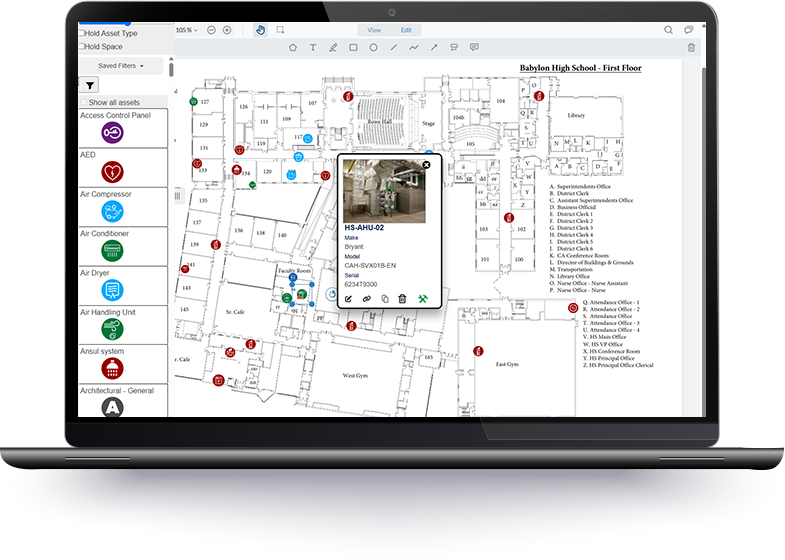
Facilities Drawings
Every Asset on an Interactive Floor Plan
Live, interactive floor plans show assets, work orders, and safety details so anyone can stand in a hallway, open a map, and see exactly what’s there and what’s been done.
How Facilities Drawings Drives Building Intelligence:
- Visual map of every building
Interactive digital floor plans for each school, built from your existing PDFs or CAD files, give everyone the same up‑to‑date view. - Every asset pinned to the plan
Hundreds of asset types are geo-located with photos, tags, specs, and history so techs see context the moment they open the map. - Point-of-service access for technicians
Mobile and offline access lets techs pull up plans, find equipment, and complete surveys or inspections without hunting for paper drawings. - Work orders and hotspots on the map
Work orders land directly on the floor plan, with heatmaps that reveal repeat failures and deferred maintenance hotspots at a glance. - Knowledge that outlives staff turnover
Photos, tags, and work history stay with each asset on the floor plan instead of living in paper binders or a retiring technician’s head.
How Building Intelligence Works in Real Life
Get one workflow where every ticket, asset, and decision is grounded in a live map of your buildings.
1. We survey your buildings and stand up live maps
Follett Software’s survey team walks your buildings with a tablet, tagging every major asset to the floor plan with photos and details so you start with complete, accurate maps and live records in both systems.
2. Tickets are logged once and land on the right room
A teacher reports a leaking ceiling tile. The request is captured in Work Orders with the right building, room, and priority—no emails, sticky notes, or hallway conversations to lose.
3. Technicians roll out once, with everything they need
On the floor plan, the work order is pinned to the correct room so the technician knows the location before they roll a truck.
4. The asset record shows everything they need
From that pin, the tech opens the asset record with photos, specs, warranty, and work history, so they show up with the right parts and plan.
5. Heatmaps turn history into district decisions
Over time, tickets build a heatmap on the plan, revealing wings and systems with the heaviest load so leaders can prioritize deferred maintenance and future projects with hard visual evidence.
What Districts Gain from Building Intelligence
These are not projections. They are outcomes districts have documented after connecting asset data to maintenance operations on one platform.
Faster, more confident troubleshooting
Technicians know exactly where to go, what they will find, and what has been tried before. Less time wasted hunting for rooms, equipment, or paper records.
Clear patterns that justify projects
Work orders mapped on floor plans and heatmaps make it obvious which wings, systems, or buildings are driving most of the cost - with visual evidence ready for any meeting.
Institutional knowledge that doesn't retire
Photos, tags, and history live with the asset on the floor plan. When staff change, the knowledge stays in the system - not just in one person's head.
Stronger capital and safety conversations
Leaders can walk boards, insurers, and safety teams through actual building data instead of stacks of paper or estimates built on memory.
More work orders completed when teams have proper planning and scheduling in place — without adding headcount.
The industry average for how much of a technician's day is spent on actual hands-on work. The rest is lost to travel, parts retrieval, and waiting before work even starts.
Cost savings when districts shift from reactive to preventive maintenance — reducing emergency repairs without significant capital investment.
How much more reactive maintenance costs vs. reliability-centered approaches — $18 vs. $6 per horsepower per year. Every failure prevented eliminates this premium.
Savings on annual energy bills achievable through well-executed O&M programs — no capital investment required. Better visibility keeps systems running at spec longer.
Public schools have no long-term facility plan for operations and maintenance. Without one, reactive maintenance dominates — driving up costs and accelerating building deterioration.
See how this would work in your district.
In a short working demo, we'll pull up your buildings in Drawings, walk through real Work Orders examples, and show exactly how Building Intelligence works for a district like yours.
Schedule a Facilities Suite DemoAccelerate with Expert Services
For districts starting from scratch - or losing institutional knowledge to retirement - professional services turn a 12-month DIY build-out into a 90-day go-live. This is often the implementation differentiator that makes the buying decision easy.
Document What You Have Before It Disappears
Trained professionals walk every building across 55+ asset categories, photograph each asset, capture manufacturer data, place them on digitized floor plans, and configure automated PM procedures. Full PM automation in 90 days - not 12+ months of DIY data entry.
What's included
- On-site asset identification and photo documentation across 55+ categories
- Assets placed directly on digitized floor plans with tags, specs, and location data
- PM procedures configured and ready to run from day one
- Data loaded directly into your Work Orders account - no manual entry required
- Maintenance program starts immediately after survey completion
Districts that use asset surveys reach full PM automation in ~90 days instead of 12-18 months. That's 9-15 months of additional savings - and institutional knowledge captured before it walks out the door.
Plan Your Tech Assets Before the Budget Conversation Starts
A technology assessment and planning service that helps districts inventory, prioritize, and defend technology infrastructure decisions with structured data - not guesswork. Designed to support both immediate budget requests and multi-year capital strategy.
What's included
- Full technology asset inventory and condition assessment across all sites
- Replacement cycle and prioritization planning based on condition, age, and risk
- Board‑ready reporting to support bond requests and annual budget submissions
- Aligned to your capital planning timeline and district budget cycle
Budget conversations without data rely on urgency. Budget conversations with documented condition data, replacement timelines, and risk ratings are fundable.
How to Evaluate Building Intelligence Tools
When you look at vendors in this space, these questions separate real building intelligence from a basic work order system with a floor plan bolted on afterward.
Can technicians see work orders on a floor plan, or only in a list?
Do work orders and floor plans share data in real time, or are they separate modules that don't talk to each other?
Can you capture assets in the field with photos and have them appear instantly on drawings and in maintenance workflows?
Can you place and update assets on digital drawings without a CAD expert?
Are there heatmaps or visual tools to see problem areas - or just tables and lists?
Does the vendor offer professional services to get to full PM automation in 90 days - or does implementation take 12+ months?