
Jump To: How Follett Delivers | The Platform | ROI Story | Professional Services | FAQs
What a Full 360-Degree View of School Operations Gives You
One connected system replaces the patchwork of paper, email, and disconnected tools most districts still rely on.
One source of truth for work orders, assets, and spaces.
01
Instant visibility into facility risk and maintenance backlog.
02
Defensible facilities data for boards and auditors.
03
Clear roadmap for facilities funding and staffing.
04
More Pressure. Fewer Resources. Operational Excellence Is No Longer Optional.
The funding gap, workforce crisis, and cost of inaction are converging — and they're not slowing down. The districts pulling ahead aren't the ones with the biggest budgets. They're the ones with the best data.
$85.5B
Estimated annual K12 public school facilities funding gap in the U.S.
Source: 2025 State of Our Schools, Table 1
D+ Grade
U.S. school infrastructure received a D+ grade from the ASCE in every assessment since 1998.
Source: ASCE 2025 Report Card, Cover page and Report Card History
54%
54% of U.S. districts report needing to update or replace multiple building systems or features in their schools.
Source: GAO-20-494, Highlights and Fast Facts sections
Three Connected Products. One Operational System.
Each product solves a specific facilities job. Together, they create a connected operational record that makes every workflow faster and every decision more defensible.
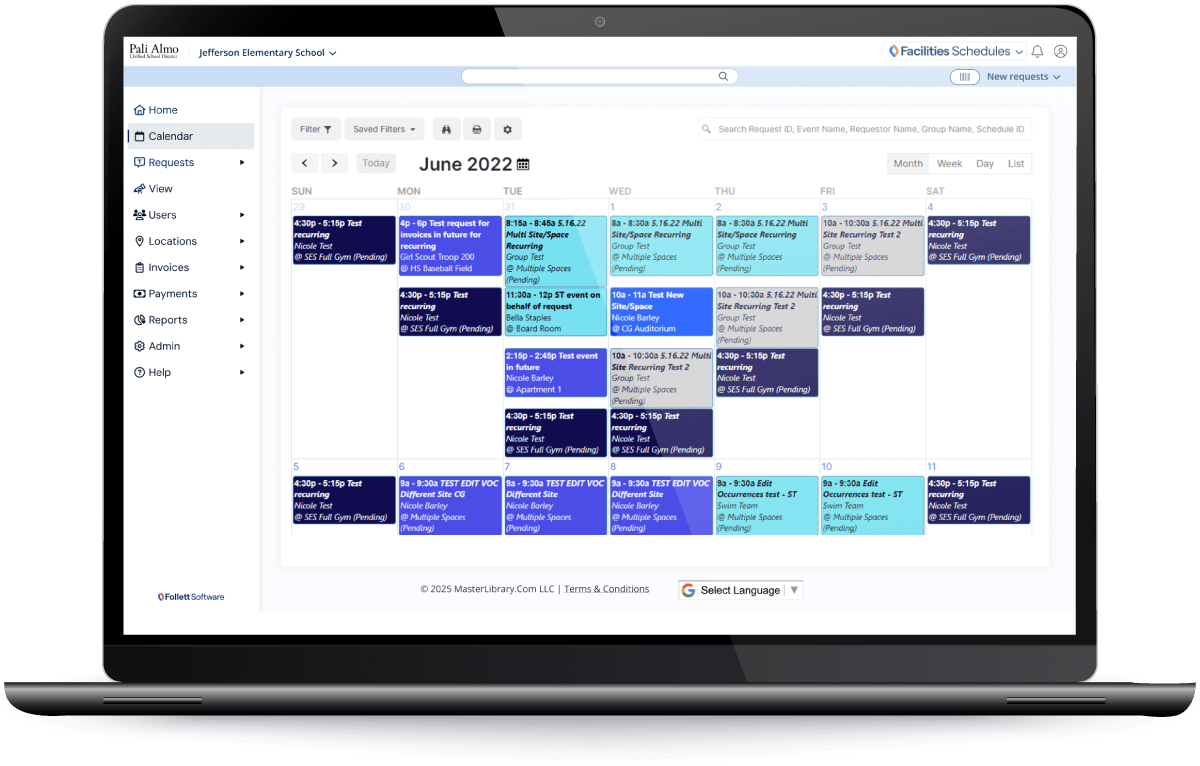
Facilities Schedules
Who Uses Your Buildings and When
Centralize every internal and community booking in a single, district-wide calendar instead of scattered paper calendars and email chains.
How Facilities Schedules Drives Operational Excellence
- One calendar for every space: Across the district get clear visibility into who’s using what, and when.
- Automatic approvals and handoffs: The system routes requests, checks conflicts, and notifies custodial and security.
- Usage analytics by space and group: Quickly see underused gyms, fields, and rooms to guide staffing and planning.
- Connected to Work Orders and Drawings: Events trigger setup/teardown work orders and appear on digital floor plans.
Features
- Online requests for gyms, fields, classrooms, and shared spaces – available 24/7, not just during office hours
- Configurable approval workflows for internal staff and community groups
- Shared calendar that prevents double-bookings and last-minute surprises across the district
- Usage history by space, organization, and time of day – so underutilized facilities surface quickly
- Integration with Event Registration for public programs and fee collection
Why It Matters
Districts report 25–30% increases in space utilization and 30–40% fewer scheduling conflicts after moving off paper and email. The 24/7 automated booking shows ROI from day one – because 60%+ of community organization searches happen outside business hours.
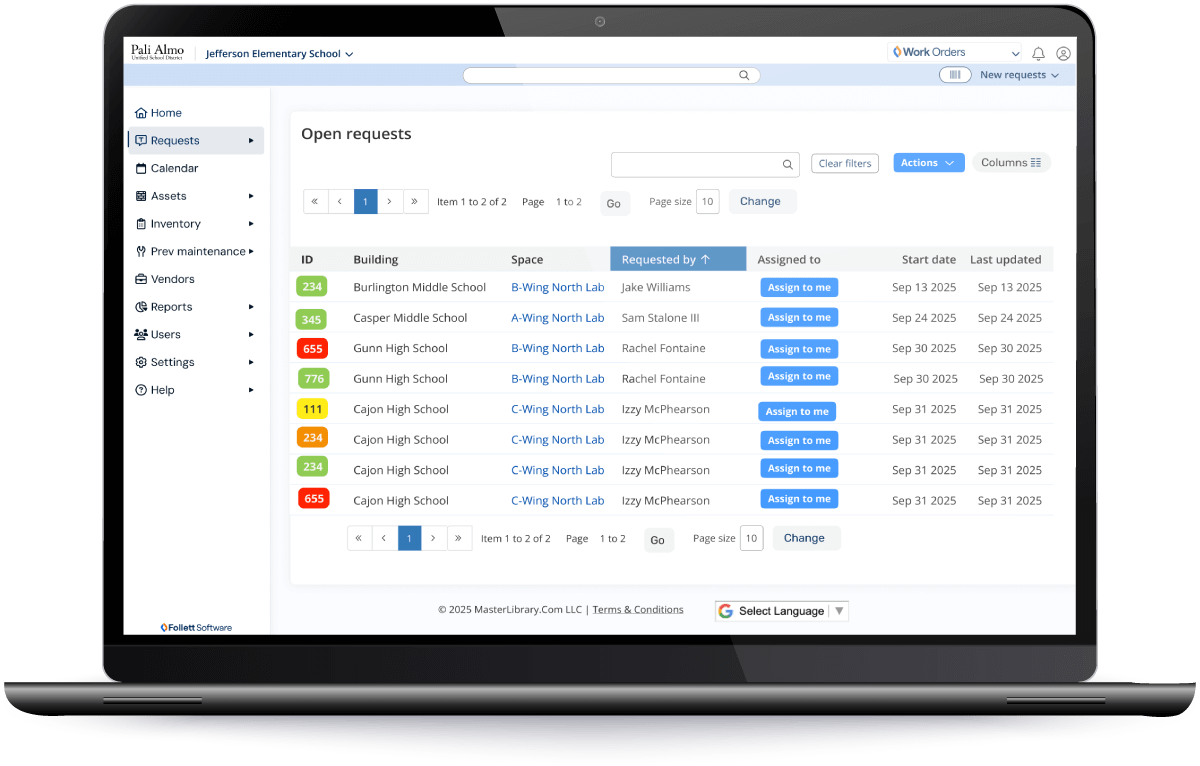
Work Orders
How You Maintain Every Building
Keep every maintenance request and preventive task in a single digital queue instead of phone calls, hallway conversations, and paper forms.
How Work Orders Drives Operational Excellence
- Central queue for all work: Every reactive request and PM task from every school in one place, so nothing gets lost or rerouted informally.
- Smart routing, priorities, and schedules: Requests auto-assign based on building or team, with priority levels and recurring PM schedules so critical systems are serviced before they fail.
- Mobile access with full history: Technicians update work from the field with asset details, photos, and past repairs at their fingertips.
- Connected to Schedules and Drawings: Work orders link to events and floor plans, so staff see deadlines, locations, and room layouts before they move.
Features
- Central intake for every maintenance request – submitted by staff, teachers, or field crews
- Automatic routing based on building, skill set, or team – no dispatcher required
- Priority levels and SLA tracking so critical issues surface first
- Mobile access so technicians update work from the field, not the office
- Full asset history and parts inventory connected to each ticket
Preventive Maintenance at Scale
- Recurring PM schedules for critical systems run automatically
- Asset surveys that seed accurate equipment lists with tags and photos
- Automated PM procedures loaded against each asset
- Reporting on completed, overdue, and upcoming PM work
Why It Matters
Districts using digital work orders report 50–60% faster response times and eliminate 30–40% of manual administrative work. Systematic preventive maintenance reduces overall maintenance costs by 20–30% and eliminates most emergency repairs over time.
Reactive maintenance costs 3–9× more than planned work – the math is not close.
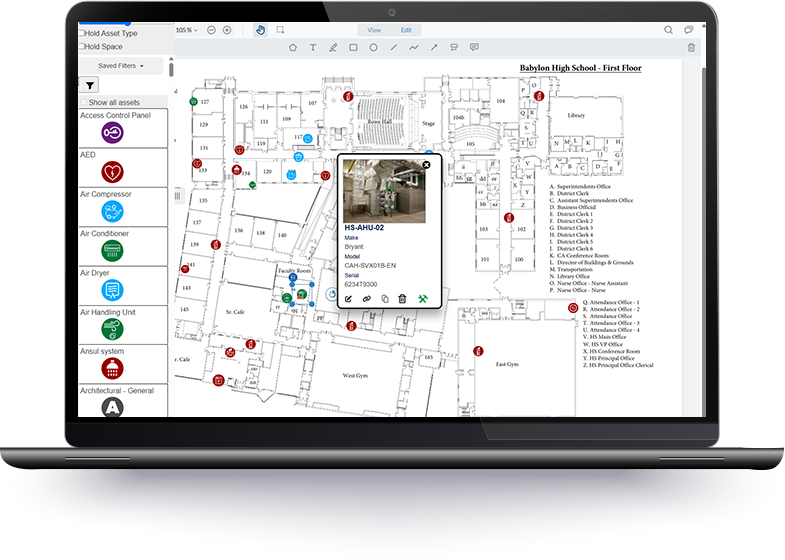
Facilities Drawings
Where Assets and Work Actually Live
Give your team interactive floor plans so they know exactly where to go, what’s in the room, and what’s already been done before they leave the shop.
How Facilities Drawings Drives Operational Excellence
- Live floor plans for every building: Assets, rooms, and life-safety details are mapped in one interactive view instead of buried in paper binders.
- Every asset and work order on the map: Technicians see exact locations, photos, and history, cutting wasted trips and guesswork.
- Visual hotspots for risk and backlog: Floor plan views and heatmaps highlight problem wings, floors, and systems at a glance.
- Connected to Work Orders and Schedules: Drawings shows upcoming work and events in context, so crews plan routes, timing, and access before they roll the truck.
Features
- 175+ geo‑located asset types on interactive digital floor plans with photo documentation and history
- Work order placement on floor maps so location is always clear before a technician moves
- Emergency routes and life safety information visible alongside assets
- Floor plan heatmaps highlighting problem areas by wing, floor, or building
- Layer‑based viewing for mechanical, electrical, and plumbing systems
Why It Matters
Technicians previously wasted hours traveling across campuses to retrieve paper building plans. Mobile access at point of service means faster troubleshooting, more accurate work, and better contractor coordination.
A single heatmap in a board presentation replaces a 50‑page spreadsheet when making the case for capital investment.
The Integration Is the Differentiator
Everyday workflows get faster and more reliable when Schedules, Work Orders, and Drawings run on the same building data in one operational system.
An event booked in Schedules automatically triggers a setup or teardown work order and places it on the floor plan in Drawings – so the crew knows exactly where to go, what to set up, and when the space needs to be ready.
SchedulesA work order submitted for a space in Work Orders shows upcoming events from Schedules, so technicians see deadlines and avoid conflicts before they start. No phone calls. No surprises.
Work OrdersAn asset failure documented in Drawings creates a pre‑populated work order in Work Orders with location, photos, and full maintenance history already attached – so staff can act immediately with complete context, not just a note on a whiteboard.
DrawingsThe ROI Story Is Documented Across Hundreds of Districts
These are not projections. They are outcomes districts have reported after moving off paper and email and into a connected operational platform.
Fewer than half of states collect representative data on their school facilities. Without consistent data, districts cannot plan, prioritize, or fund maintenance effectively.
Source ASCE 2025 Report Card, Condition section, p. 166
The average U.S. public school building is 49 years old, approaching the end of its designed service life. Fewer than half have undergone significant renovation.
Source: ASCE 2025 Report Card, Condition section
According to the ASCE 2021 Infrastructure Report Card, four in ten public schools do not have a long-term facility plan in place to address operations and maintenance.
Source: ASCE 2021 Infrastructure Report Card
Strong operations and maintenance programs can cut annual energy bills by 5 to 20% without major capital projects.
Based on industry agnostic facilities operations research.
Source U.S. DOE FEMP O&M Best Practices Guide, Release 3.0
Maintenance staff spend only 25 to 35% of their day on hands-on work. Better planning and scheduling tools raise that to 55%, a 57% productivity gain, enabling teams to close more work orders without adding headcount.
Based on industry agnostic facilities operations research.
Source Palmer, Maintenance Planning and Scheduling Handbook, 4th ed., Chapter 1 and Appendix F
In a typical facilities operation, 40 to 60% of all maintenance activity is reactive. Best performers keep that below 10%. The gap shows up in shorter equipment life, higher labor costs, and more emergency disruptions.
Based on industry agnostic facilities operations research.
Source: FEMP/Biedenweg, Table 1
See how this would work in your district.
A focused working session maps your workflows, identifies savings, and outlines a clear path forward.
Schedule a Facilities Suite DemoTechnology Alone Doesn't Capture Knowledge That's Walking Out the Door
69% of maintenance professionals are 50 or older. When experienced staff retire, the knowledge of building systems, quirks, and maintenance history leaves with them. Our professional services team helps districts capture that knowledge fast – and build a data foundation that outlasts any single person.
Document What You Have Before It Disappears
Our field teams survey your buildings, photograph assets, and load structured data directly into your Work Orders account – creating a durable digital record that survives staff turnover, supports capital planning, and makes preventive maintenance automation possible in about 90 days rather than a year‑long manual build‑out.
What's included
- On‑site asset identification and photo documentation across every building
- Preventive maintenance procedures configured and ready to run from day one
- Data loaded directly into your Work Orders account – no manual entry required
- Capital planning data structured and ready from day one
Districts that use asset surveys reach full PM automation in ~90 days instead of 12–18 months. That’s 9–15 months of additional savings.
Plan Your Tech Assets Before the Budget Conversation Starts
A technology assessment and planning service that helps districts inventory, prioritize, and defend technology infrastructure decisions with structured data – not guesswork. Designed to support both immediate budget requests and multi‑year capital strategy.
What's included
- Full technology asset inventory and condition assessment across all sites
- Replacement cycle and prioritization planning based on condition, age, and risk
- Board‑ready reporting to support bond requests and annual budget submissions
- Aligned to your capital planning timeline and district budget cycle
Budget conversations without data rely on urgency. Budget conversations with documented condition data, replacement timelines, and risk ratings are fundable.
How to Evaluate K-12 Facility Operations Software
When districts compare options, they look for more than a feature list. Use these criteria when you talk with vendors or build an RFP.
K‑12 specific workflows – school calendars, multi‑site operations, and community use built in, not bolted on
A single platform for work orders, PM, assets, utilities, scheduling, and floor plans – not disconnected tools that don’t talk to each other
Mobile readiness for technicians who spend their day in buildings, not at desks
Evidence of ROI from real districts – not just projected outcomes or vendor claims
Services that shorten time to value – asset surveys and PM configuration so you don’t spend 12 months building what should take 90 days
A vendor with deep K‑12 experience – not a commercial CMMS adapted for schools after the fact
What Districts Ask Before They Buy
Straight answers to the questions we hear most often.